The IEA follows the Organization of the Petroleum Exporting Countries (OPEC) outlook released earlier this week and has revised down its 2025 Oil demand forecast. Another downside revision adds more conviction to a bearish outlook on Oil prices in the long term.
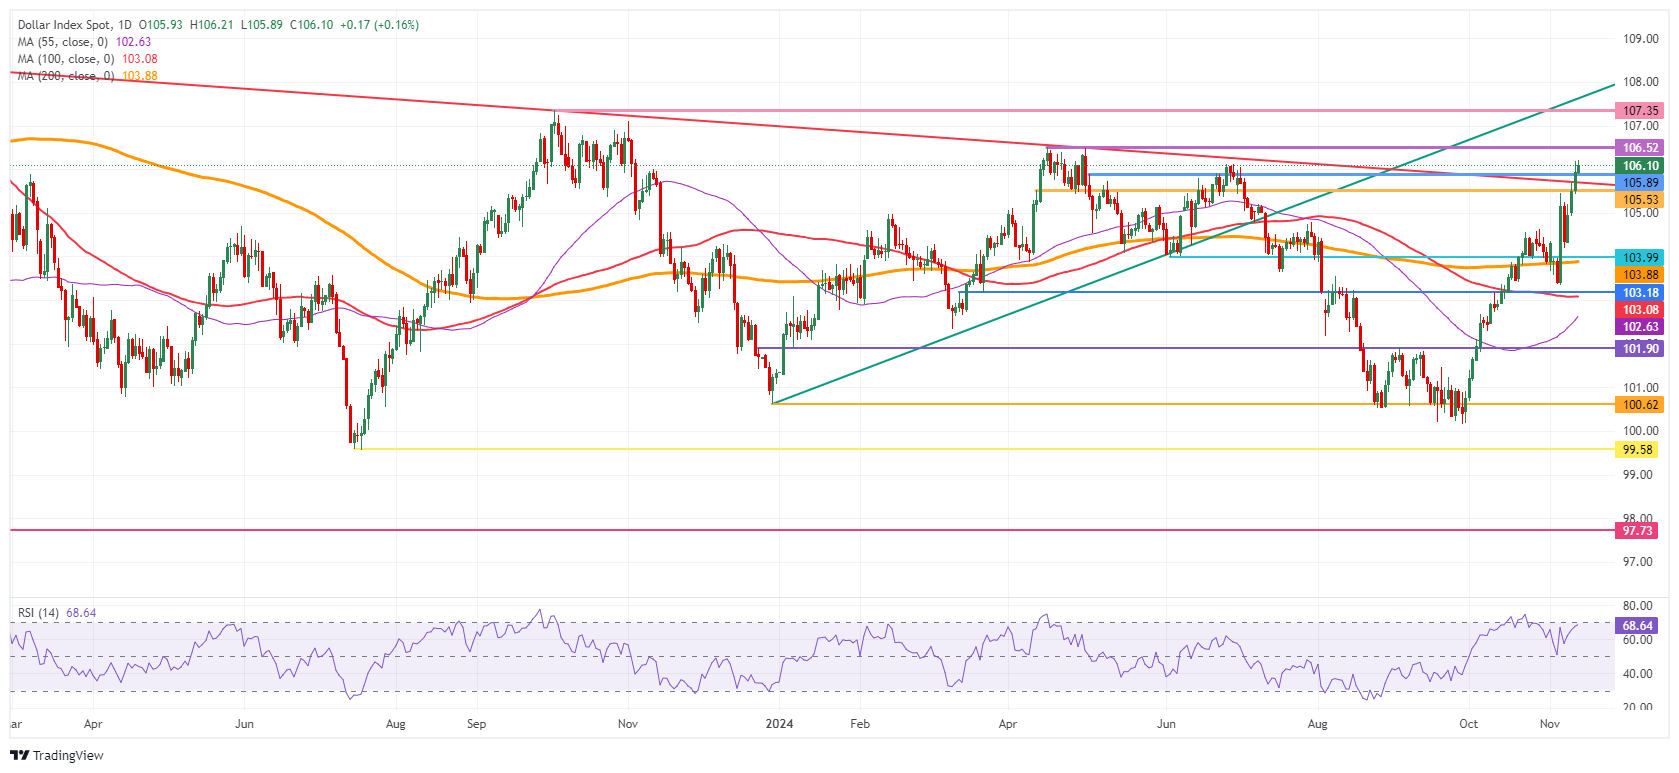
The US Dollar Index (DXY), which tracks the performance of the Greenback against six other currencies, extended gains and reached a fresh year-to-date high above 107.00 ahead of the US trading session.
In the economic data front, the US Producer Price Index (PPI) for October came in a touch stronger than expected on Thursday, after the US Consumer Price Index (CPI) released on Wednesday fell broadly in line with expectations. All eyes will be on the Federal Reserve (Fed) Chairman Jerome Powell speech, scheduled at 20:00 GMT, with traders looking for clues on the December interest rate cut.
At the time of writing, Crude Oil (WTI) trades at $68.99 and Brent Crude at $72.80
Oil news and market movers: Here comes EIA
A privately owned Chinese refiner bought West African crude in a rare purchase. Normally, independent processors in China tend to favor imports from Iran and Russia, Bloomberg reports. Non-OPEC capacity will be boosted by new offshore conventional projects. Projects in Brazil, Guyana, and Norway are set to add to the already oversupplied market, according to the IEA's monthly Oil Market Report. In its report, the IEA lifted its forecast for this year's oil-demand growth but slightly trimmed next year's estimates, citing the impact of China's economic slowdown on consumption, Bloomberg reports. The US Energy Information Administration (EIA) will release its weekly Crude Oil price changes at 16:00 GMT. Expectation is for a build of 1.86 million barrels against the previous build of 2.149 million barrels last week.
Oil Technical Analysis: Should you buy into a bounce?
Crude Oil price is starting to show the pattern that precedes a breakout, with lower highs and higher lows. A breakout looks imminent from a purely technical point of view. With all these bearish elements taken into account, a break to the downside seems rather plausible than a pop to the upside.
On the upside, the 55-day Simple Moving Average (SMA) at $70.25 is the first barrier to consider before the hefty technical level at $73.58, with the 100-day Simple Moving Average (SMA). The 200-day SMA at $76.68 is still quite far off, although it could get tested in case tensions in the Middle East arise.
On the other side, traders need to look towards $67.12 – a level that held the price in May and June 2023 – to find the first support. In case that level breaks, the 2024 year-to-date low emerges at $64.75, followed by $64.38, the low from 2023.
Categories
Articles
News
Investors Digests
Main Courses
News
Strategies
Indicators
Guides
Workbooks
Glossary
Lessons
A Glossary
B Glossary
C Glossary
D Glossary
E Glossary
F Glossary
G Glossary
H Glossary
I Glossary
J Glossary
K Glossary
L Glossary
M Glossary
N Glossary
O Glossary
P Glossary
Q Glossary
R Glossary
S Glossary
T Glossary
U Glossary
V Glossary
W Glossary
X Glossary
Y GLossary
Z GLossary
Recent posts

Zcash
26 Nov 2024
Zilliqa (ZIL)
26 Nov 2024
GBP/CAD Price Prediction: Rising Wedge ...
8 Nov 2024


